Introduction
Report automation tools can free you from manual spreadsheet edits, late-night exports, and frantic last-minute dashboards. Are you tired of copying data, formatting slides, and emailing the same metrics every week? This post answers the core question — what these tools are, when to use them, and how to implement reliable, auditable reporting workflows that save time and reduce errors. I write from hands-on experience automating reporting pipelines for teams of different sizes, and I’ll walk you from concept to production-ready steps, show code snippets, and point to the best platforms for scheduled delivery, data transformation, and visualization. Expect practical how-to steps, vetted tools, compliance notes, and copy-ready checklists so you can start automating reports today.
What are report automation tools, and why they matter
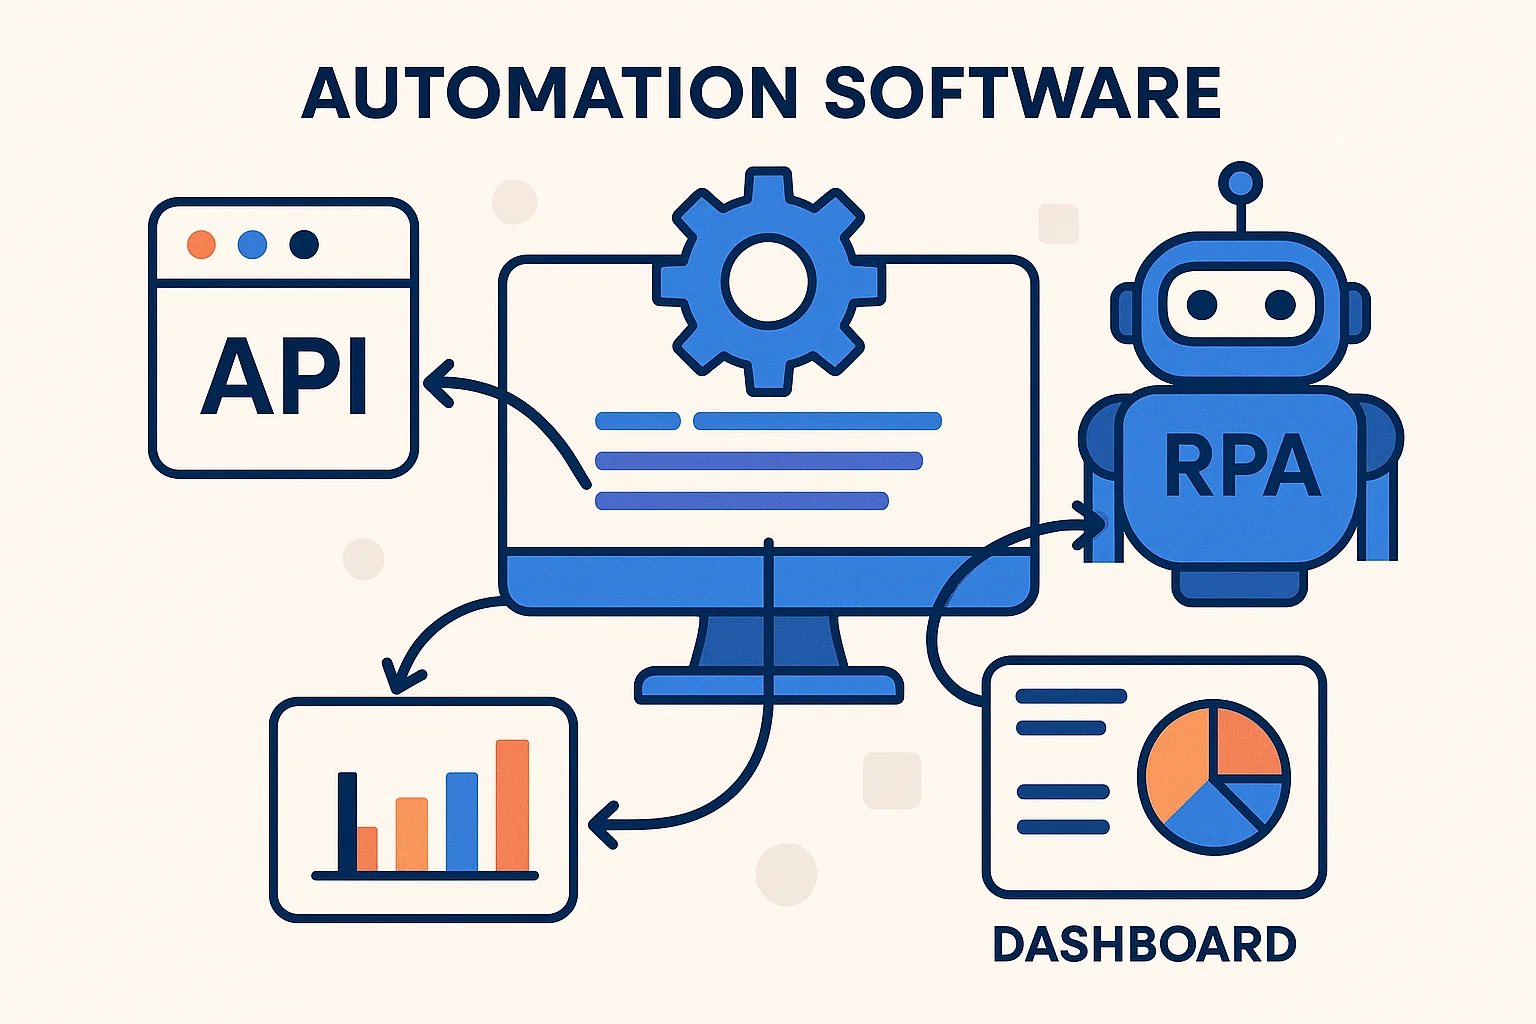
Report automation tools are software or services that gather data from sources, transform it into a usable format, create visuals or documents, and deliver reports on a schedule or in response to events. They eliminate repetitive manual steps, reduce human errors, and speed decision cycles.
History and context
Reporting began as manual exports from databases and spreadsheets, then evolved into Business Intelligence (BI) platforms that centralize visualization. Modern report automation blends BI, ETL, scheduling, and workflow automation so you can build end-to-end pipelines that run unattended. Tools now cover the full stack, from data extraction to scheduled email delivery, and many offer built-in connectors for common services. See vendor docs for scheduling and delivery features. Microsoft Learn+2Looker Studio+2
Why report automation matters
Automated reporting saves time, increases consistency, and provides timely insights to stakeholders. It also creates an auditable trail for decisions, which is crucial for compliance and iterative improvement. In my experience, teams that automate even a handful of recurring reports reclaim hours weekly and gain faster reaction time to anomalies.
How to implement report automation tools, step-by-step
Below is a practical, repeatable roadmap to automate reports reliably.
- Define the report and audience
- Capture who needs the report, required metrics, delivery frequency, and format (PDF, dashboard link, CSV). Clear scope prevents feature creep.
- Map data sources and access
- List APIs, databases, spreadsheets, and file stores. Confirm credentials and any rate limits or data retention rules.
- Choose tooling for each layer
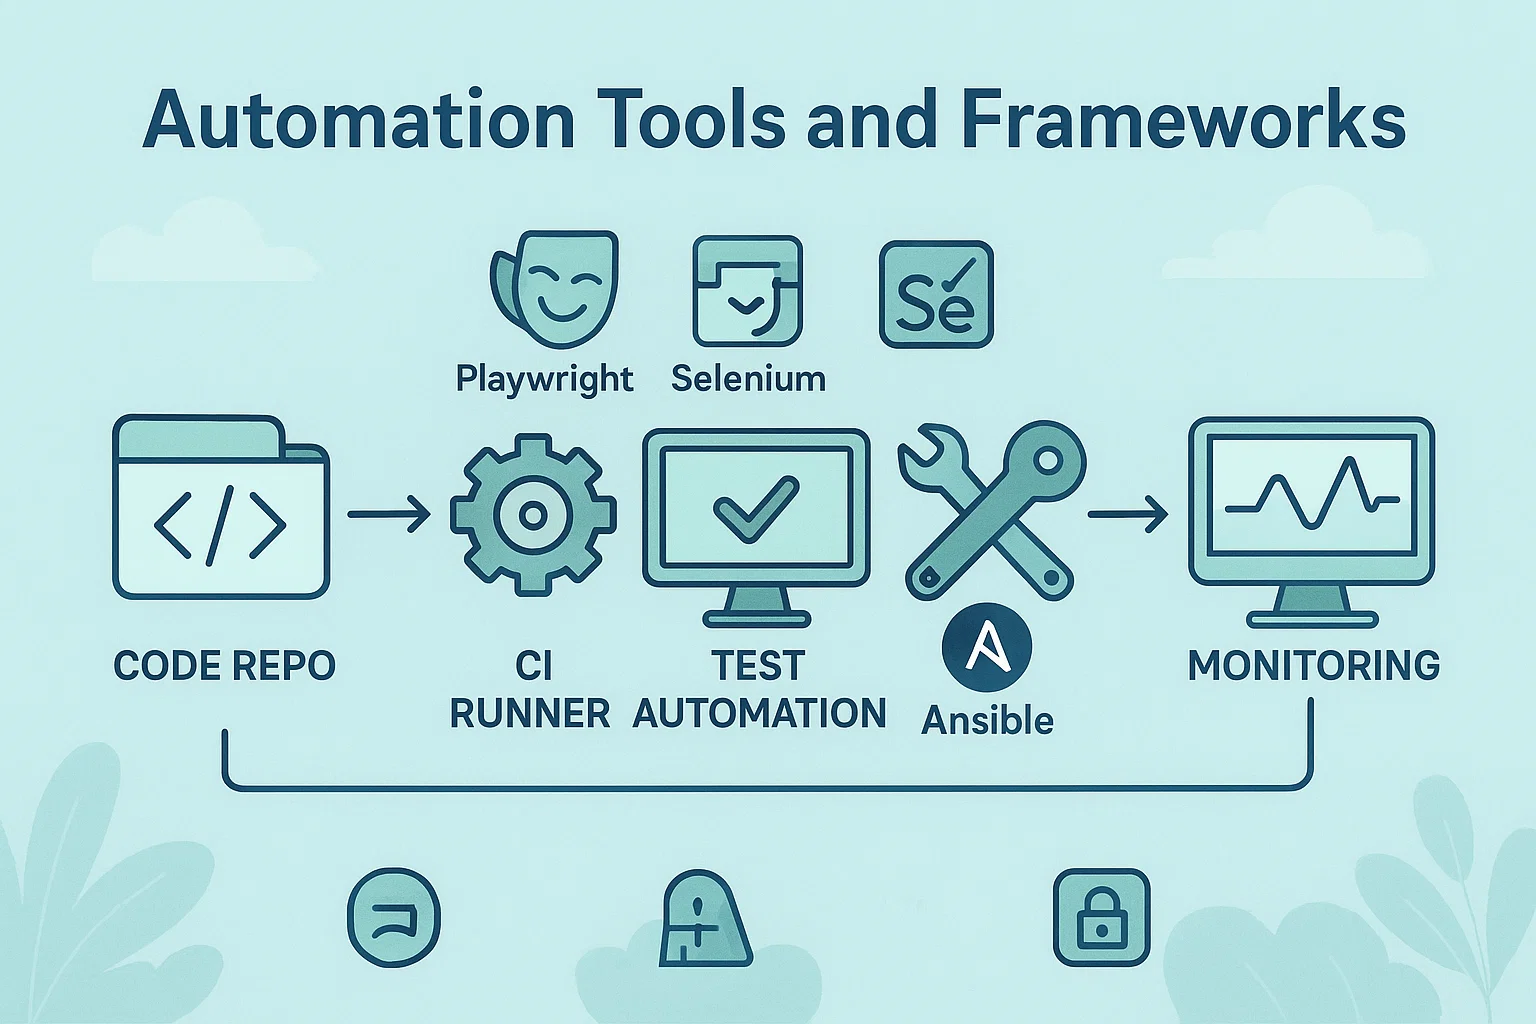
- Extraction/ETL: small scripts, Airflow, or low-code tools.
- Storage and transformation: data warehouse, or lightweight DB.
- Visualization: Looker Studio, Power BI, Tableau, or self-hosted options.
- Orchestration and delivery: Zapier, Power Automate, scheduler on your server, or native platform subscriptions. Vendor docs explain scheduling and delivery options. Google Cloud+2Microsoft Learn+2
- Prototype the pipeline
- Build the minimal flow that extracts, transforms, and produces the output. Test with representative data.
- Automate scheduling and error handling
- Use built-in schedulers or cron-like jobs, add retries and notifications on failure, and keep idempotency in mind.
- Gate access and audit
- Attach metadata, timestamps, and checksums so reports are traceable and auditable.
- Iterate with recipients
- Get early feedback and refine visuals, thresholds, and delivery cadence.
Quick checklist
- Credentials stored securely, rotate keys.
- Webhooks or email deliverability tested.
- Backups for source data and generated reports.
- Logging and alerting for failed runs.
Python code example: generate and email a PDF report
# Python: generate a simple PDF report from pandas and email it
# pip install pandas matplotlib fpdf2
import os, smtplib
import pandas as pd
import matplotlib.pyplot as plt
from fpdf import FPDF
from email.message import EmailMessage

def make_chart(df, out_png):
    plt.figure(figsize=(6,3))
    df.plot(kind='bar')
    plt.tight_layout()
    plt.savefig(out_png)
    plt.close()

def make_pdf(title, image_path, out_pdf):
    pdf = FPDF()
    pdf.add_page()
    pdf.set_font("Arial", size=14)
    pdf.cell(0, 10, title, ln=True)
    pdf.image(image_path, x=10, y=30, w=190)
    pdf.output(out_pdf)

def send_email(subject, body, to_addr, attachment):
    msg = EmailMessage()
    msg['Subject'] = subject
    msg['From'] = os.getenv('REPORT_FROM')
    msg['To'] = to_addr
    msg.set_content(body)
    with open(attachment, 'rb') as f:
        msg.add_attachment(f.read(), maintype='application', subtype='pdf', filename=os.path.basename(attachment))
    with smtplib.SMTP_SSL('smtp.example.com', 465) as s:
        s.login(os.getenv('SMTP_USER'), os.getenv('SMTP_PASS'))
        s.send_message(msg)

# Usage: df = pd.DataFrame({...}); make_chart(df, 'chart.png'); make_pdf('Weekly KPIs','chart.png','report.pdf'); send_email(...)
Notes: Use a secure SMTP provider, environment variables for secrets, and add retries in production.
Node.js code example: pull Google Sheets and POST to a webhook
// Node.js: read Google Sheet rows and send to a webhook for automation
// npm install googleapis node-fetch
const {google} = require('googleapis');
const fetch = require('node-fetch');

async function readSheet(auth, spreadsheetId, range) {
  const sheets = google.sheets({version: 'v4', auth});
  const res = await sheets.spreadsheets.values.get({spreadsheetId, range});
  return res.data.values || [];
}

async function postToWebhook(url, payload) {
  const res = await fetch(url, {
    method: 'POST',
    body: JSON.stringify(payload),
    headers: {'Content-Type': 'application/json'}
  });
  if (!res.ok) throw new Error('Webhook failed: ' + res.statusText);
  return res.json();
}

// Example: authenticate with service account, call readSheet, then postToWebhook
Notes: Use service accounts for server-to-server access, and map rows to structured JSON for downstream processing.
Recommended tools, best practices, pros and cons
Best practices
- Prefer official connectors and APIs over scraping, for reliability and compliance.
- Centralize logging so one dashboard shows pipeline health.
- Use role-based access and limit who can change delivery schedules.
- Provide a preview or sandbox so recipients can validate reports before they go live.
Recommended tools by use case
- Looker Studio (visualization, scheduling) for lightweight dashboards and scheduled deliveries. Google Cloud+1
- Power BI (enterprise BI + automation) for integrated automate visuals and flows. Microsoft Learn+1
- Tableau (robust dashboards, subscriptions) for rich visual analytics and subscription delivery. Tableau Help+1
- Zapier / automation platforms for stitching microtasks, triggers, and sending report snapshots or summaries. Zapier+1
Pros and cons
Pros
- Faster decision cycles, fewer manual errors, scheduled distribution to stakeholders.
- Cons
- Initial setup time, need for credential management, and potential cost for enterprise features.
Challenges, legal and ethical considerations, troubleshooting
Compliance and ethics
Always respect privacy and data minimization. If PII or regulated data moves through your pipeline, follow legal requirements in your jurisdiction, and prefer aggregated metrics when possible. Use APIs rather than scraping, and document retention policies clearly. For complex regulations, consult legal counsel.
Troubleshooting common issues
- Missing data: check source query time windows, and ensure ETL jobs run after upstream jobs complete.
- Delivery failures: verify SMTP or webhook endpoints and check spam filtering.
- Rate limits: implement exponential backoff and async batching.
- Unauthorized errors: rotate credentials and verify permission scopes.
Blockquotes (paraphrased, authoritative)
Platforms encourage designers to request the least permissions needed and to be clear about what data is used, to protect users and improve trust. Google for Developers+1
Automation vendors recommend server-side verification and signed webhooks to make billing and reporting reliable and auditable. Zapier+1
FAQs
What is report automation tools?
Report automation tools are software that automatically collects data, transforms it, creates visuals or documents, and delivers reports on a schedule or trigger, reducing manual work and errors.
How do I choose the right report automation tool?
Start with required data sources, delivery format, and scale. Choose lightweight tools like Looker Studio for simple dashboards, or Power BI/Tableau for enterprise features. Match tool connectors to your data sources.
Can I automate reports without coding?
Yes, many automation platforms and BI tools offer no-code connectors, scheduled exports, and email delivery. For advanced customization, lightweight scripts bridge gaps.
Are scheduled reports secure to send by email?
They can be, with proper encryption and access controls. Prefer secure share links for sensitive data, and limit recipients. Use email providers with TLS and authentication.
How do I test report automation pipelines?
Create a sandbox with sample data, run scheduled jobs manually, inspect logs, and validate outputs with stakeholders before switching to production.
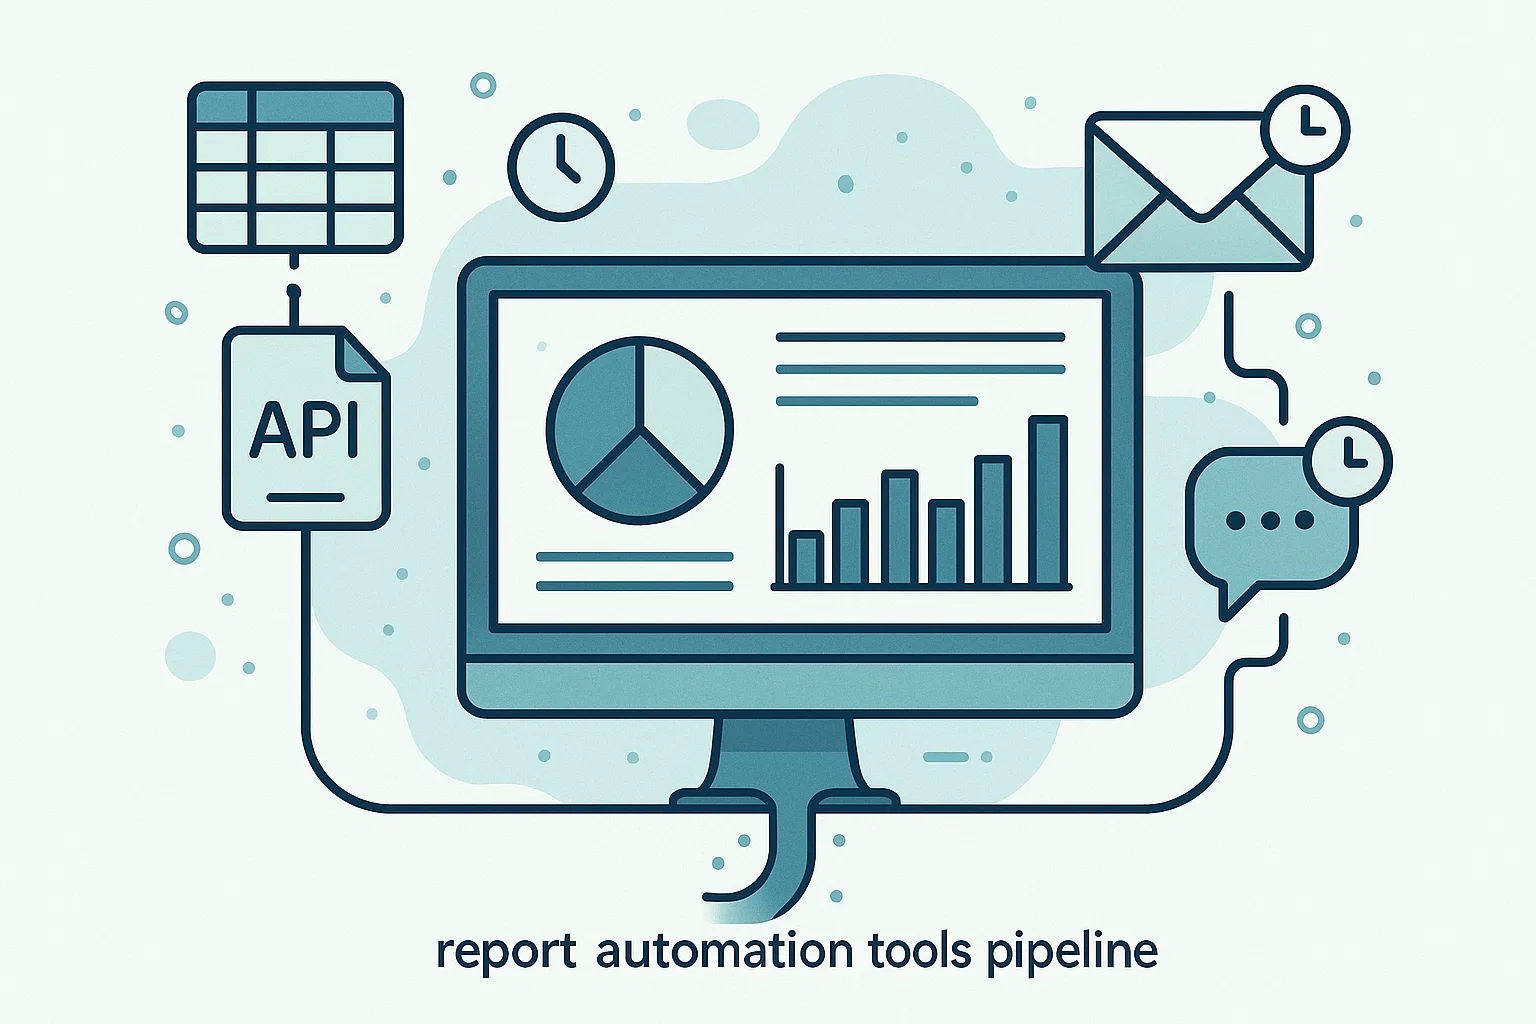
What are common delivery formats for automated reports?
PDFs, CSVs, dashboard links, and snapshot images are common. Choose the format that matches recipient needs, and include context and change notes.
How do I handle failed runs or partial data?
Build retry logic, alerts, and send a failure notice with a clear remediation step. Keep historical snapshots so you can compare runs.
How much does report automation cost?
Costs vary: many visualization tools have free tiers, while enterprise features, scheduled delivery, and data warehouse usage can add up. Calculate based on data volume, frequency, and user seats.
Conclusion and call to action
Key takeaway, report automation tools let you automate data collection, transformation, visualization, and delivery, saving time and producing reliable, auditable outputs. Start by defining the report and audience, prototype a minimal pipeline, and add scheduling, error handling, and permissions. If you want, I can help design a runnable pipeline for your data sources, or convert one of the code samples into a deployable job tailored to your stack. Try automating one weekly report this week, and measure the time you reclaim.